Air quality near main roads: what the maps can and cannot tell you
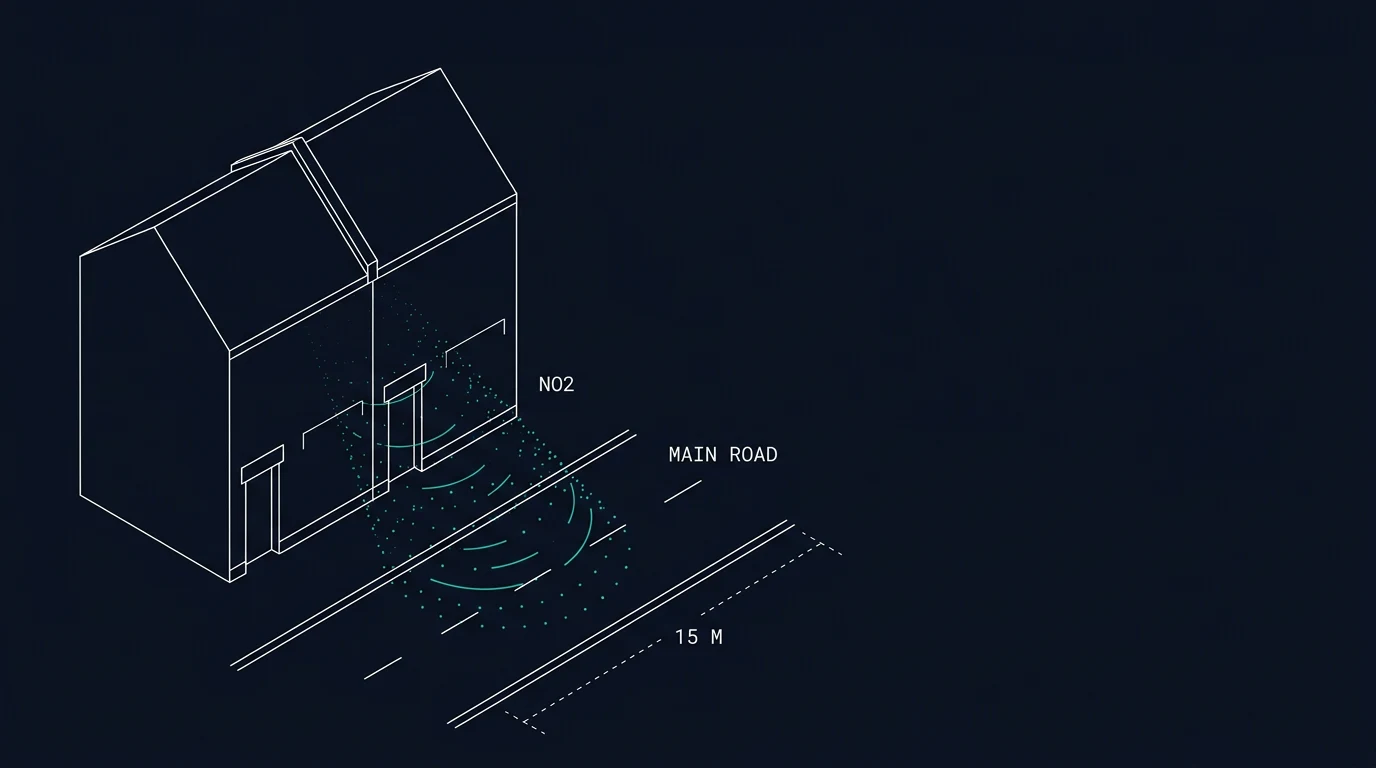
The air outside a house you are considering buying is not something you can see, and the national maps are coarser than they look. This guide explains what the two main pollutants are, how Defra's models and the council's monitoring differ, and which checks are worth the ten minutes before you commit.
The two pollutants that matter most for a street
Nitrogen dioxide (NO₂) comes mostly from vehicle exhausts, especially diesel, and from gas combustion. Concentrations are highest beside busy roads, at junctions where vehicles queue, and in street canyons where tall buildings on both sides stop pollution dispersing. Levels fall quickly with distance from the kerb.
Fine particles (PM2.5, particles under 2.5 micrometres across) come from many sources at once: traffic (exhaust and brake and tyre wear), solid fuel burning, industry, construction, and long-range transport. Because the sources are mixed and particles travel, PM2.5 is more evenly spread than NO₂ — which is why a back street off a main road is often still exposed to similar particle levels as the main road itself.
There is a third thing worth knowing: PM10 covers larger particles, including dust from construction and some brake wear, and is measured separately. It is less often the deciding factor for a residential street.
Why two nearby streets can differ
A background map treats a square kilometre as one value. A street is a much smaller thing. Where buildings stand in an unbroken row on both sides of a road, the air above the road circulates in a loop instead of dispersing freely, a pattern air-quality science calls a street canyon. Traffic emissions collect in that loop. A continuous canopy of mature trees over the same street can act as a lid on the canyon and slow how quickly pollution escapes, which is one reason the effect of planting depends on whether trees are tall and closed or low and open.
None of this is visible on a national map. It is read from the street itself: the height and continuity of the buildings, the width of the road, the gaps between blocks, and whether the trees form a roof or a hedge.
How the national maps work — and where they stop
Defra's Pollution Climate Mapping (PCM) produces two different products, and they answer different questions.
Background maps. Modelled annual mean concentrations on a 1 km grid, for NOx, NO₂, PM10 and PM2.5. These are the maps most postcode tools use. A 1 km square is about the size of a large housing estate, so a grid value describes the general area, not the first row of houses on a main road.
Roadside concentrations. Defra also models concentrations at specific roadside locations on the major road network, because the 1 km grid cannot resolve the kerbside. This is the layer that shows where the annual mean NO₂ limit value is at risk of being exceeded. It is published through the compliance data hub and is worth looking at if the property fronts or backs onto an A road or above.
The practical consequence: a modest background figure near a major road does not tell you what the front bedroom experiences. Conversely, a higher background figure in a town centre does not mean every street there is the same.
What local authorities add
Councils have duties the national modelling does not perform.
Air Quality Management Areas (AQMAs). Where a local authority finds that objectives are unlikely to be met, it must designate an AQMA — usually a corridor along specific roads rather than a whole district — and publish an action plan. Many councils also run NO₂ diffusion tubes at kerbside and façade locations, which gives measured rather than modelled data for particular streets.
Smoke control areas. Some built-up areas are designated, restricting what can be burned and which appliances can be used. The council publishes the designation and any exemptions.
Planning. Air quality may be a material consideration for new development nearby, and for the property itself if it is close to a designated area. The council's planning portal is the place to check applications that could add traffic.
The numbers, in context
- NO₂: the UK's long-standing limit value for the annual mean is 40 µg/m³, assessed at locations of relevant public exposure. Measured kerbside values in some city centres have exceeded this in recent years, though concentrations have fallen as fleets have renewed.
- PM2.5: the Environmental Targets (Fine Particulate Matter) (England) Regulations 2023 set an annual mean concentration target of 10 µg/m³ to be met across England by the end of 2040, plus a population exposure reduction target. Interim milestones sit between now and then.
- Scotland, Wales and Northern Ireland have their own frameworks and reporting, though the pollutant limits are closely aligned.
A single annual mean figure hides the pattern that matters for a household: rush-hour peaks, still winter days when pollution accumulates, and the fact that concentrations indoors track outdoor levels unless windows are shut.
Day to day: the Daily Air Quality Index
Defra's Daily Air Quality Index (DAQI) rates air quality from 1 (low) to 10 (very high) for five pollutants, with advice bands. It is a forecast and monitoring tool for today and tomorrow, not a description of a property's long-term exposure. It is useful for choosing when to ventilate or when to avoid strenuous activity outdoors, and it is the source behind most weather-app air quality widgets.
For any health question — including what pollution means for a person with a heart or lung condition, or for children — the right sources are the NHS and the UK Health Security Agency, not a property website.
Checks worth doing before you buy
- Look at the road layout, not just the address. Distance from the kerb, junctions, traffic lights, bus stops and hills all change exposure. Stand at the front window and watch what passes for ten minutes at 8am.
- Check the council's AQMA map and monitoring data for the specific street. Measured tubes on a façade tell you more than a 1 km grid.
- Look at Defra's roadside layer if the property is near a major road, and at the background map for the square it sits in.
- Check the planning portal for consented developments that add traffic, and for any nearby industrial or waste permits (the Environment Agency publishes these).
- Notice solid fuel use. Chimneys in use on the street, and whether the area is a smoke control area, matter more in winter.
- Think about the building. A top-floor flat above a bus route, a house with windows on the main road, and a back-of-block flat facing a courtyard are three different situations.
HabitatReport's free postcode check at /check shows Defra's modelled yearly background NO₂ for the area around a postcode, alongside flood, radon, noise, broadband and energy figures. It is a modelled 1 km figure — read it as the area's background, then use the council data and the roadside model for the street itself.
- SE1 (Southwark): 27.4
- NW1 (Camden): 26.0
- N1 (Islington): 25.4
- SW3 (Kensington and Chelsea): 24.3
- W2 (Westminster): 24.3
- E14 (Tower Hamlets): 23.1
- E16 (Newham): 21.4
- N16 (Hackney): 20.9
If you want to know about one address
Portable monitors and low-cost sensors vary a lot in accuracy, and their readings are not directly comparable with regulatory monitors. If you want measurements you can rely on, the council's own monitoring data and the nearest Defra automatic monitoring station are the reference points; a short-term consumer sensor is better at showing relative patterns (busy times, still evenings) than absolute concentrations.
What to do next
Arrange the checks in this order: council AQMA and monitoring data for the street, Defra's roadside and background layers, planning applications, then a visit at rush hour. Start with the area figures at /check, and keep the official pages open as you go — they are the part that stays accurate.
Questions
Does a good reading on the air quality map mean the street is fine?
Not necessarily. The national maps are modelled at 1 km grid squares, and Defra also models roadside concentrations separately because the grid cannot resolve the first few metres from a kerb. A house on a busy road can sit inside a grid square that looks unremarkable, while the roadside model for that same stretch of road is higher. Check both, and check whether the council monitors nearby.
What is an Air Quality Management Area?
A local authority must declare one where air quality objectives are not likely to be met. Councils then produce an action plan and, in many cases, monitor NO2 with diffusion tubes. An AQMA is a statement about measured or modelled exceedance in the district, often along specific roads, not a label on a whole town.
What are the limits for NO2 and PM2.5 in the UK?
The long-standing UK and EU-derived limit value for nitrogen dioxide is an annual mean of 40 µg/m³, assessed at locations where people are exposed. For fine particles, the Environmental Targets (Fine Particulate Matter) (England) Regulations 2023 set an annual mean concentration target of 10 µg/m³ to be met across England by the end of 2040, alongside a population exposure target.
Does traffic noise tell me anything about air quality?
They are related but not the same. Both rise with traffic volume, and the same road tends to cause both, but noise depends on speed, surface, gradient and barriers, while concentrations depend on emissions, wind, street canyons and how quickly pollution disperses. A noisy road on a breezy ridge can measure better than a quiet-seeming street between tall buildings.
Where do wood burners fit in?
Domestic solid fuel burning is a recognised source of fine particles, especially in winter and in areas with many open fires or stoves. Some urban areas are smoke control areas, where only authorised fuels and appliances may be used. Your council publishes whether an area is designated and what the rules are there.
Sources
- Defra UK-AIR — modelled background pollution data (PCM)
- Defra UK-AIR — modelled air quality data
- Defra — Air Quality Compliance Data Hub
- Defra UK-AIR — PM2.5 targets and the Environment Act
- Defra UK-AIR — Daily Air Quality Index
- Defra — Local Air Quality Management (LAQM) support
- Environment Agency — public register of permits